Uranium Graphing project
- What topic I chose and why I chose it?
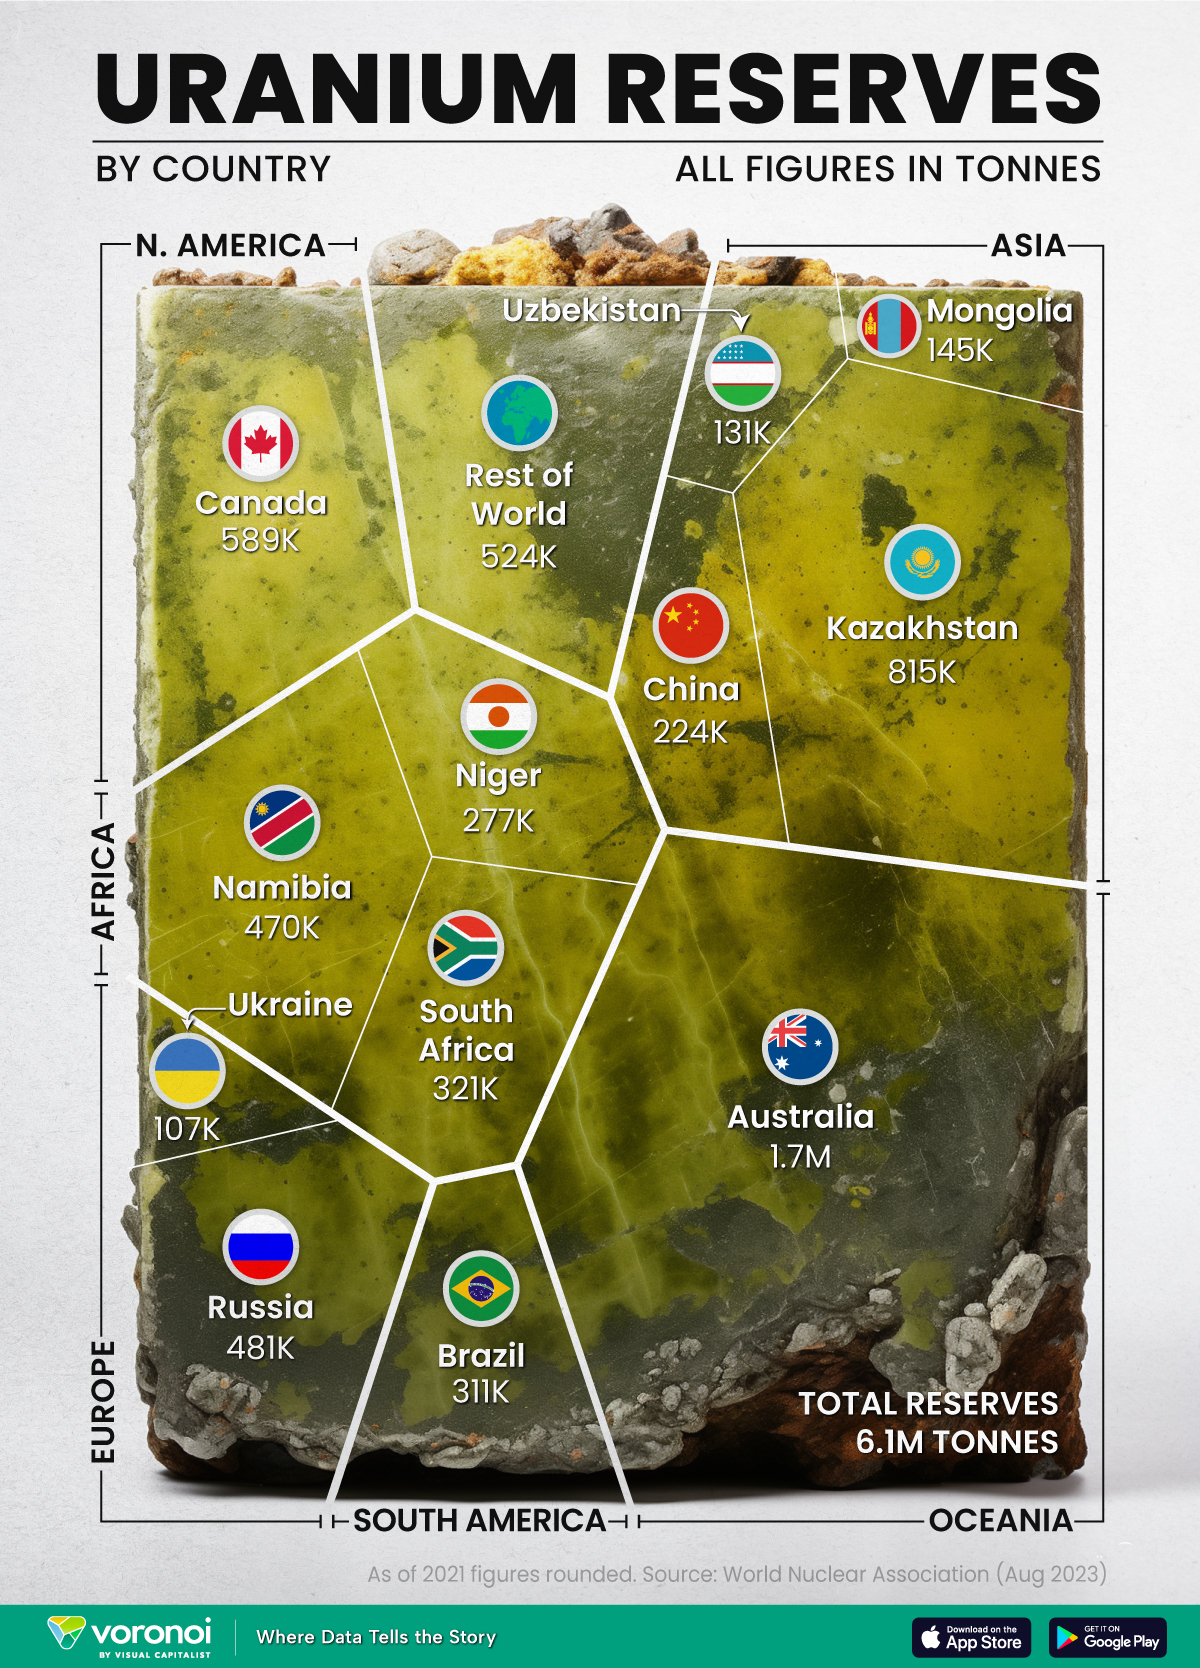
I chose to look at Uranium reserves in the world. Charted: Global Uranium Reserves By Country (visualcapitalist.com) I chose this topic because I thought it was interesting to learn about nuclear energy.
- Description of Physical Features
This chart shows the known uranium reserves in tonnage around the world. It is broken down into countries and by continents.
- What the Visual Tells us & Information Given
The visual tells us how many tons of Uranium reserves each country on the diagram has compared to other countries and the rest of the world. Australia has the biggest chunk because it has the largest uranium reserve in the world. Canada has the most uranium in North America.
- Visual Feature That Caught my eye
The visual that caught my eye was the way the graph lines and sections looked different and it was not just a textured bar graph. I liked how it was large piece of uranium divided into how much each country has in reserves.
- Do I Feel Comfortable Extracting Data?
Yes. This chart shows me different sized sections based on how much uranium has so it is easy to tell compare each country has.
- The Most Outstanding Part of the Visual
The most outstanding part of this visual would be the piece of Uranium that the chart is placed on.
- Who Would use This Data?
Companies that own powerplants or want to build power plants could use this graph to see where the best place to get Uranium from would be.
Bean Growth Project
Description & What I learned
This is the bean graph that I made for math. When growing my bean I did not take proper care of it so it died. I had to get data from a past assignment to make the graph for this project.
I learned that it is very important to take care of your bean. If you dont take care of your bean, your bean will die. I also learned how to make a graph in Excel.

")
")
")


")
")
")